GIS Applications to Determine Access to Education and Optimise School Locations
Background
Due to its large and overwhelmingly young population, Nigeria is characterised as having the world’s greatest out of school population, which is estimated to be 10.5 million (UIS, 2017). While this is due to a variety of socio-cultural and economic factors, the inaccessibility of educational facilities is often flagged as a key issue. Research has shown that the main contributing factors to primary school absenteeism in North West Nigeria include low levels of parental education, gender inequality, low incomes, perceived teacher performance, and prohibitive distances to schools (Shehu, 2018). The effect of distance is further highlighted by Kazeem et al., who note that living 20 or more minutes away from a school reduces the odds of attendance by 52% (2010).
Nigeria’s Universal Basic Educational Commission (UBEC) has established a range of policies that aim to address the issues of school absenteeism, as identified in the “Minimum Standards for Basic Education in Nigeria” (UBEC, 2010). As per these standards, no student should have to travel more than two kilometres to the nearest school.
Over the past decade, the use of Geographic Information Systems (GIS) to analyse access to education in Nigeria has become increasingly popular. In 2014, a GIS analysis was conducted to determine the school-age population’s travel distance to secondary schools in Ogun State (Ogunyemi et al, 2014). However, there is currently no research that applies geospatial data to pinpoint where new schools should be constructed in the country.
GRID3 Nigeria aimed to bridge this gap by demonstrating where new schools should be strategically built to improve access to education, while at the same time strengthening UBEC’s geospatial capacity to perform such analyses.
Determining access to education
In order to visually and quantitatively demonstrate the current state of the school-age population’s access to primary schools throughout the country, UBEC’s National Personnel Audit (NPA) dataset and the GRID3 Nigeria Population Estimates were utilised. The NPA dataset is a geospatial inventory of all schools in the country. Since the GRID3 population dataset provides gridded estimates of the number of children aged 5<10 for every 100m x 100m grid cell, GRID3 was able to calculate the percentage of children within each local government area (LGA) that live within 2km of a school (Figure 1). As shown in Figure 1, percentages are lowest in the North East, particularly in Borno state. LGAs within many South South and South East states have rates as high as 95-100%. This analysis was also performed at the ward level, which provides further detail that is particularly useful for LGA and state policy officials. In late 2019, results were presented to UBEC for their review and feedback. The maps and analyses were so well-received that UBEC formed a small technical team that will be dedicated to GIS capacity building in order to ultimately perform these analyses independently.
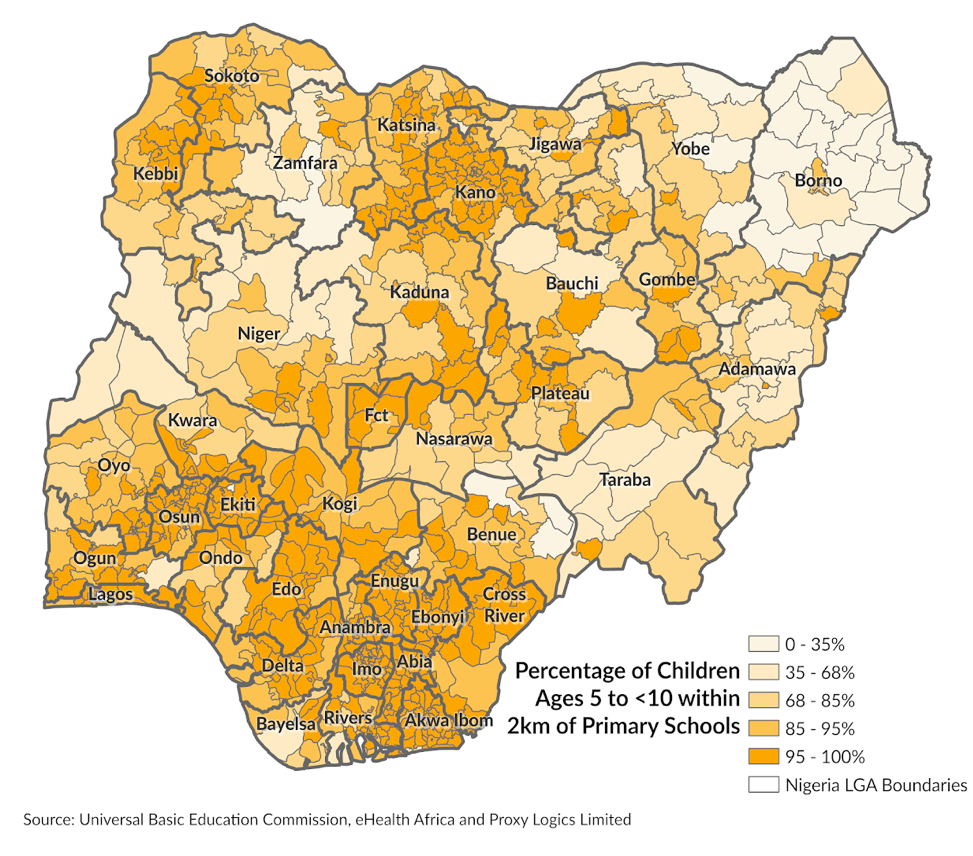
Figure 1. Percentage of children, ages 5<10, within each LGA, that reside within 2km of a primary school. Data sources: GRID3, Universal Basic Education Commission, eHealth Africa, and Proxy Logics Limited.
Optimising school locations
Another component of GRID3’s approach was to determine the location where new schools should be built. GRID3 has developed an optimisation model that simulates the placement of schools in locations that maximise coverage and student access. Sample results from the tool are shown below. Figure 2 is a country map that demonstrates the location of existing primary schools and where new primary schools should be constructed according to model results. Figure 3 is a graph that shows the percentage of the population within 2km of schools as a function of the number of additional schools constructed.
There are diminishing returns as more schools are built; but the impact of strategically building the first few hundred or thousand schools is significant.
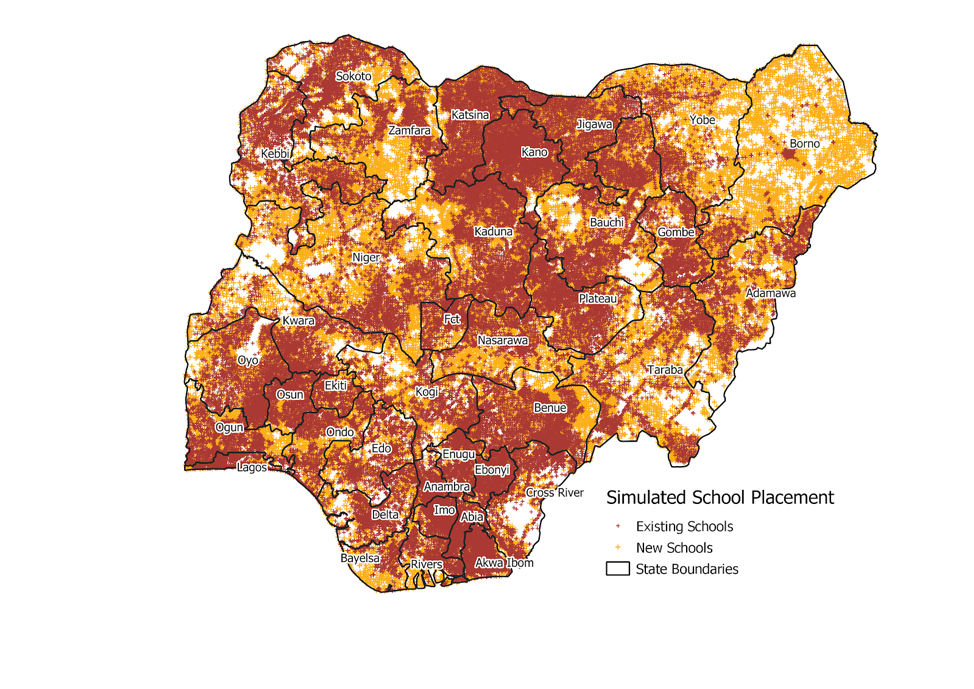
Figure 2. Nigeria country map demonstrating existing school locations and proposed locations of new schools, according to GRID3’s school optimisation model. Data sources: GRID3, Universal Basic Education Commission, eHealth Africa, and Proxy Logics Limited.

Figure 3. Graph demonstrating the percentage of the school-age population within 2km of a school as a function of the number of newly constructed schools.
Next steps
Simulation results and model methods will be presented to UBEC and select State Universal Basic Education Boards in March 2020. During this engagement trip, GRID3 expects to receive valuable feedback that will help improve the model and customise it to the needs of national and state education agencies for eventual handover and long-term adoption.
Kazeem, A., Jensen, L., & Stokes, C. S. (2010). School Attendance in Nigeria: Understanding the Impact and Intersection of Gender, Urban-Rural Residence and Socioeconomic Status. Comparative education review, 54(2), 295–319. https://doi.org/10.1086/652139.
Shehu, H. K. (2018). Factors Influencing Primary School Non-attendance among Children in North West Nigeria. Literacy Information and Computer Education Journal (LICEJ), 9(2), 2916-2922.
UBEC. (2010). Minimum Standards for Basic Education in Nigeria. Available online: https://nlipw.com/education-national-minimum-standards-establishment-institutions-act/.
UNESCO Institute for Statistics. (2017). Nigeria, Education and Literacy. UNESCO. Available online: https://uis.unesco.org/en/country/ng.