Background
The Zambian administrative hierarchy has a four-tier system that comprises provinces, districts, constituencies, and wards. Since the 2010 census mapping exercise, the administrative boundaries have changed with the creation of an additional province (Muchinga) and many new districts, constituencies, and wards. As of May 2019, there are 10 provinces, 116 districts, 156 constituencies, and 1,624 wards in Zambia. The Office of the Surveyor General (OSG) is responsible for national, provincial, and district boundaries, alongwith the Ministry of Local Government and Housing (MLGH), while the Electoral Commission of Zambia (ECZ) is responsible for mapping wards and constituencies countrywide. Given that administrative boundaries are created by different institutions at different mapping scales with little coordination, boundaries are often not aligned. Misaligned boundaries create inaccuracies during the integration of datasets from various institutions, and also hinder data-sharing and utilisation among stakeholders.
Challenge and need
In May 2018, the United Nations Population Fund (UNFPA) Country Office, in coordination with the Ministry of Lands-Office of the Surveyor General, Zambia Statistics Agency (ZamStats), Ministry of National Development Planning-Population (MNDP) and Development Department, and the University of Zambia (UNZA) produced a project proposal describing potential opportunities for GRID3 work in Zambia, including the need for GRID3’s assistance with the harmonisation of administrative boundaries and codes.
During the technical mission in November 2018, GRID3 held a kickoff meeting with the boundary data custodians including ECZ, OSG and ZamStats. At this meeting, the government stakeholders emphasized the magnitude of the need for harmonized administrative boundaries, and described how a lack of harmonized boundaries has limited their ability to effectively use and share geospatial boundaries data for efficient planning and decision-making. Following the technical mission, several meetings were held with key government stakeholders and the GRID3 national team to discuss next steps and develop an approach to the harmonisation of districts (second level) and wards (fourth level).
Key stakeholders
- Zambia Statistics Agency (ZamStats)
- Electoral Commission of Zambia
- Ministry of Local Government and Housing
- Ministry of National Development Planning, Population and Development department
- NSDI Steering and Technical Committees
- Survey General’s Office – Ministry of Lands
- University of Zambia
Workshop methodology
In preparation for the boundaries harmonisation workshop, GRID3 team has prepared map documents and a workflow for editing sessions. A pre-workshop practicing session was held a day before the start of the workshop, for GIS technicians from each ministry, to go over the workshop methodology and practise the editing workflow. At the start of the workshop participants were divided into groups in which at least one participant from each organisation was present, each group was given one map document to edit the boundaries. A GIS technician from each group connected his laptop to a projector to visualise the editing session, for all group participants to see and discuss the edits. The map document included a layer of ward and district boundaries, polygons representing gaps and overlaps, an imagery basemap from ESRI, topographic maps at a scale of 1:50,000 and 1:250,000, cadastral maps, as well as geospatial files representing rivers, roads, towns, and beacons. In each group, a representative from MLGH would read the district narrative while a GIS technician would pan around the district polygon using topographic maps and other reference layers to follow the narrative description. Each boundary misalignment was discussed as a group before an edit is made when boundaries custodians are in agreement of how the boundary is edited.
In order to align district boundaries to topographic features as described in the narrative, the gap or overlap polygon was either merged to the correct unit or retraced. Imagery was turned on when the boundary needed to be aligned and switched on and off to make sure the revised boundary was consistent with both topographic maps and the natural features on the ground. GRID3 team was assisting the GIS technicians when support with an editing tool was needed.
Data
To conduct boundaries analysis for the pre-workshop assessment, GRID3 partners obtained the latest district and ward boundaries from ZamStats & OSG, as well as 116 narratives describing district boundaries delineations.
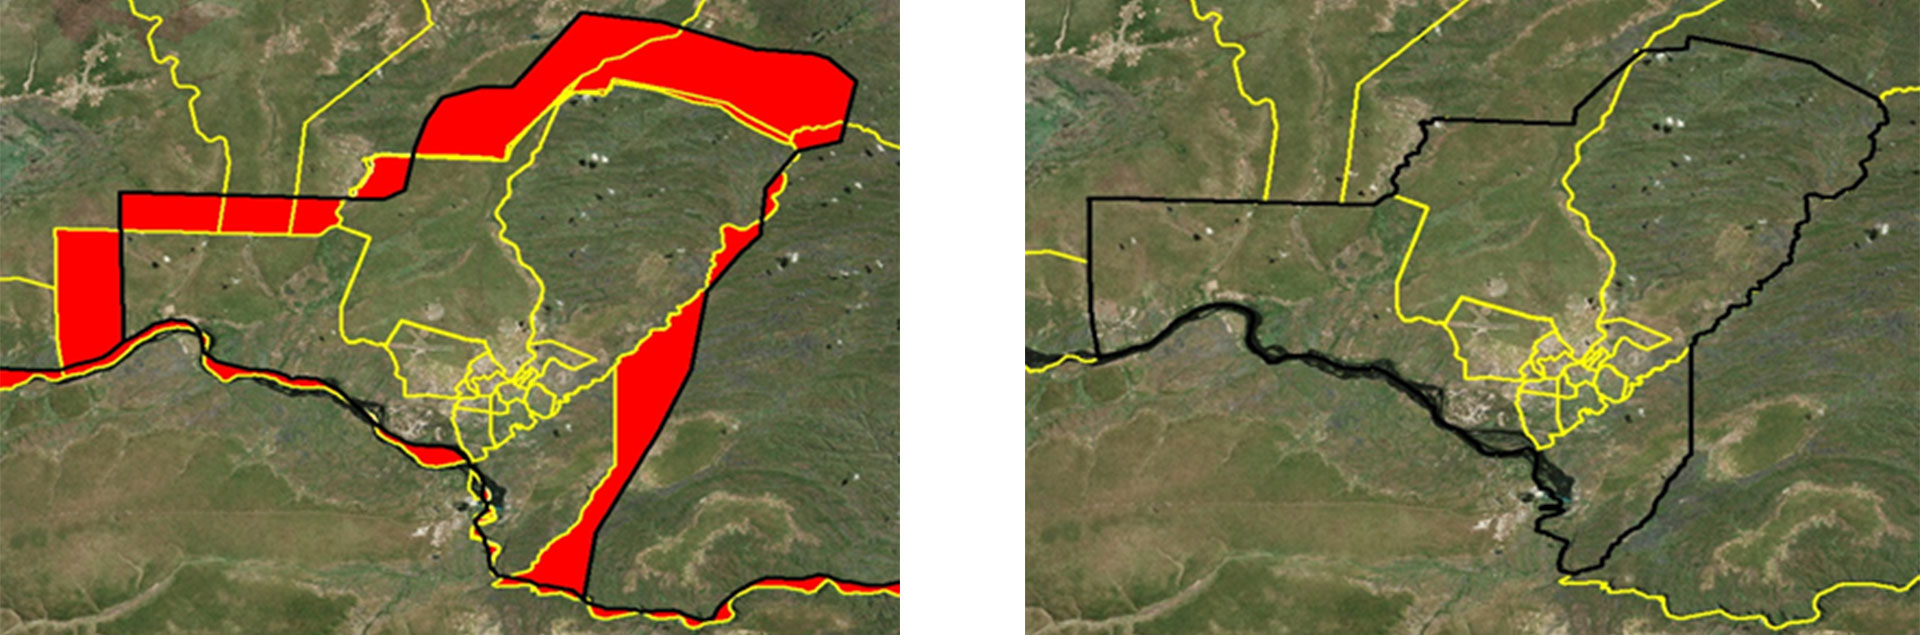
Figure 1: Livingstone District, before (left) and after (right) boundary harmonization. Red areas represent gaps and overlaps.
Outputs
The output from the boundaries harmonisation exercise is an updated district shapefile validated against officially endorsed narratives and aligned to topographic features at a scale of 1:10,000, which corresponds to the mapping scale used by Electoral Commission of Zambia for ward delineation. The second output is a ward shapefile aligned to the district boundaries. Another important output is the harmonisation of codes among districts, wards, and provinces (which are now consistent among administrative boundaries, allowing for correct aggregation of administrative units from higher to lower levels).
Outcomes
One important outcome of the boundaries harmonisation was the identification of issues within the district narratives, such as typological or spelling errors and content errors. In the course of the boundaries harmonisation workshop, participants recorded any identified errors within narratives and tracked any changes that have been made to the text. Upon the completion of the workshop, a letter from the OSG was sent to the Director of Ministry of Local Government and Housing explaining the issues found in the narratives and requesting to engage the Ministry of Justice to review and publish new Statutory Instruments.
Impact
GRID3 Zambia facilitated coordination among all government agencies responsible for boundaries in Zambia to ensure a production of government- endorsed administrative boundaries shapefiles. The harmonised shapefiles are now used among government ministries as the official boundary set for all planning and decision-making.
In September 2019, GRID3 received feedback from the OSG describing how the updated district boundaries are being used by local authorities or councils to resolve land disputes. Most district councils in Zambia have little or no capacity to interpret their area of jurisdiction, which often results in councils occupying land beyond the boundaries of their authority. In such instances, the team from the OSG is called upon to assist local councils with resolving land disputes. The land disputes between councils are resolved by referring to the district maps as well as to district narratives to determine which district the property belongs to. Given that the land disputes occur at various levels (such as the city, farm plot, or property level), it is important to have high resolution district boundaries that follow topological features precisely.
The Office of Surveyor General often collaborates with ECZ to conduct ward delineations. During the delineation exercises, community members and decision-makers meet to discuss proposed edits to the wards and determine whether the wards are nested within a particular district or need to be split/merged based on the population counts. For this reason, the district maps and accompanying narratives are being referenced to make sure any edits done to the ward boundaries are within a particular district’s boundary.
Next steps
Shortly after the boundaries harmonisation workshop, the GIS technicians from ECZ were deployed to the field for a ward demarcation exercise in preparation for the presidential election scheduled for 2021. Once the demarcation exercise is completed, a topology analysis would need to be repeated to identify if any gaps and overlaps have been introduced as part of the ward demarcation.
GRID3 has developed an ArcGIS model builder tool that automates the topology analysis to identify areas of boundaries misalignments. The tool will be presented and transferred to the custodians of administrative boundaries to ensure capacity for the independent validation of district and ward shapefiles.
In the next few months, GRID3 will be coordinating with the boundaries custodians to establish a set of topology rules, specifying key spatial relationships that are important to maintain when edits are being made to either wards or districts. The specified topology rules in the file geodatabase will help enable boundaries custodians to maintain a harmonised set of administrative boundaries.
Learning & continuous development
The key positive output was the deep trust it placed in the government to guide and conduct the delineation process. GRID3 provided technical support, but relied on the government of Zambia for strategic direction in the mapping process, the selection of the relevant stakeholders, the verification process, and the data distribution. Without government integration, a nationally accepted and accessible dataset could not have been generated.
GRID3 provided capacity strengthening to various relevant government officials on how to harmonise boundaries. This ensures that officers can update data (e.g., when new districts are created even after the project ends). Some of the government officers who helped with the delineation were GIS lecturers from UNZA who provide GIS training to government officials.
In November 2019, district shapefiles have been officially shared by the OSG with the ECZ, ZamStats, MLGH, Disaster Management and Mitigation Unit (DMMU), Forestry Department within MLNR, Department of National Parks and Wildlife (DNPW), and the Ministry of Health (MoH), Ministry of Development and Planning (MNDP), Zambia Electricity Supply Corporation Limited (ZESCO), Rural Electrification Authority (REA), National Remote Sensing Center (NRSC), as well as MLGH’s provincial and district offices. To determine whether there are any implications for other use cases, GRID3 will be following up with the above listed ministries to identify how the updated district boundaries have contributed to potential improvements in their workflows.
| Dataset | Source |
| Proportion of People Living in Poverty | Tatem AJ, Gething PW, Bhatt S, Weiss D and Pezzulo C. (2013). Pilot high resolution poverty maps. University of Southampton/Oxford University. DOI : 10.5258/SOTON/WP00200 |
| Density of Pigs | Gilbert M, G Nicolas, G Cinardi, S Vanwambeke, TP Van Boeckel, GRW Wint, TP Robinson (2018) Global Distribution Data for Cattle, Buffaloes, Horses, Sheep, Goats, Pigs, Chickens and Ducks in 2010. Nature Scientific data, 5:180227. doi: 10.1038/sdata.2018.227 |
| Travel Time to Health Facilities | [Adapted from] Weiss DJ, Nelson A, Gibson HS, Temperley W, Peedell S, Lieber A, Hancher M, Poyart E, Belchior S, Fullman N, Mappin B, Dalrymple U, Rozier J, Lucas TCD, Howes RE, Tusting LS, Kang SY, Cameron E, Bisanzio, D, Battle KE, Bhatt S, Gething PW. (2018). A global map of travel time to cities to access inequalities in accessibility in 2015 . Nature. |
| MODIS Mean Land Surface Temperature | Wan Z, Hook S, Hulley, G. MOD11C3 MODIS/Terra Land Surface Temperature/Emissivity Monthly L3 Global 0.05Deg CMG Voo6 [Data set]. NASA EOSDIS Land Processes DAAC. |
| Settlement Type (interpolated) | [Derived from GUF & GHSL] Pesaresi M, Ehrlich D, Florczyk A J, Freire S, Julea A, Kemper T, … Syrris, V. (2015). GHS built-up grid, derived from Landsat, multitemporal (1975, 1990, 2000, 2014). Esch T, Heldens W, Hirner A, Keil M, Marconcini M, Roth A, … Strano, E. (2017). Breaking new ground in mapping human settlements from space – The Global Urban Footprint. ISPRS Journal of Photogrammetry and Remote Sensing, 134, 30–42. |
| Distance to the Edge of Cultivated Areas | ESA (European Space Agency) CCI (Climate Change Initiative) Land Cover project 2017. “Land Cover CCI Product – Annual LC maps from 2000 to 2015 (v2.0.7).” https://maps.elie.ucl.ac.be/CCI/viewer |