Demographics of Financially Included and Excluded Populations in Nigeria
Background
In February 2019, Data Science Nigeria (DSN), a non-profit organisation committed to driving solution-oriented applications of artificial intelligence in Nigeria, with support from the Lagos Business School (LBS), Nigeria Inter-Bank Settlement System (NIBSS), and Central Bank of Nigeria (CBN), initiated the development of an open data ecosystem and knowledge platform for policymakers. The purpose of this platform was to consolidate disparate data sources from the public and private sectors to create a unified analytical view for data-driven strategic decision-making. The primary focus was on health, education, financial services, and agriculture. To demonstrate the potential impact of this full open data project, a proof-of-concept was developed focussing on financial inclusion.
The objective of this work was to demonstrate analyses and visualisations for financial policymakers to better understand the distributions, patterns, and demographics of financially included and excluded populations. It is expected that this work will be used to support the national financial inclusion agenda and serve as a platform for data analytics and decision-making that is supported by appropriate governance and management frameworks.
Challenge and need
During the GRID3 Nigeria Use Case Workshop, which was held from 9-10 April 2019, attendees from DSN demonstrated interest in using the GRID3 Nigeria population estimates to calculate financial inclusion indicators as part of their larger open data ecosystem and knowledge platform in order to address the lack of access to financial services experienced by millions of Nigerians. Providing access to bank services is a crucial step toward lifting people out of poverty, but in the absence of reliable financial inclusion data, it can be difficult to understand where and how new services should be allocated.
DSN specifically requested that GRID3 generate estimates for adult male and female populations at local government area (LGA) and state levels to be able to calculate rates for banked , interbanked , underbanked , and unbanked populations. In addition to the population estimates, DSN asked GRID3 to share specific Point of Interest (PoI) datasets, including the locations of schools, markets, and health facilities, in order to visualise spatial relationships between the numbers of these facilities and the aforementioned financial inclusion indicators.
Response
In response to DSN’s enthusiasm to use GRID3 data and their request to collaborate, GRID3 Nigeria generated and shared population totals at LGA and state levels for adult males and females. GRID3 also shared the school, market, and health facility PoI datasets.
GRID3 data
- GRID3 Nigeria Population Estimates v1.1, adult males and females;
- GRID3 Nigeria Schools;
- GRID3 Nigeria Markets;
- GRID3 Nigeria Health Facilities.
Additional data
DSN combined the GRID3 data with the Bank Verification Number (BVN) dataset and interbank transactions provided by NIBSS and CBN, which consisted of customer and card information, electronic fund transfers, mCash information, and instant payment, point of sale, computerised maintenance management system, and check transactions. All data were anonymised to protect the identity and privacy of bank account owners.
Key stakeholders
Funding was provided by the Bill & Melinda Gates Foundation to make the open data ecosystem and knowledge platform possible, while LBS served as the project manager and fund distributor.
GRID3, NIBSS and CBN were the data providers. DSN was the implementing partner who performed the analyses.
Outcome and impact
In order to better understand financial inclusion throughout the country and measure the “banked” population, the BVN Penetration Index was calculated by dividing the number of BVN accounts by the adult population for various administrative levels. Image 1 demonstrates the BVN Penetration Index for each state. As shown in the map, the northern part of the country has noticeably lower BVN penetration in comparison to the south. The highest figures occur in the Federal Capital Territory (FCT) and Lagos states, with rates of 88.31% and 144.59%, respectively.
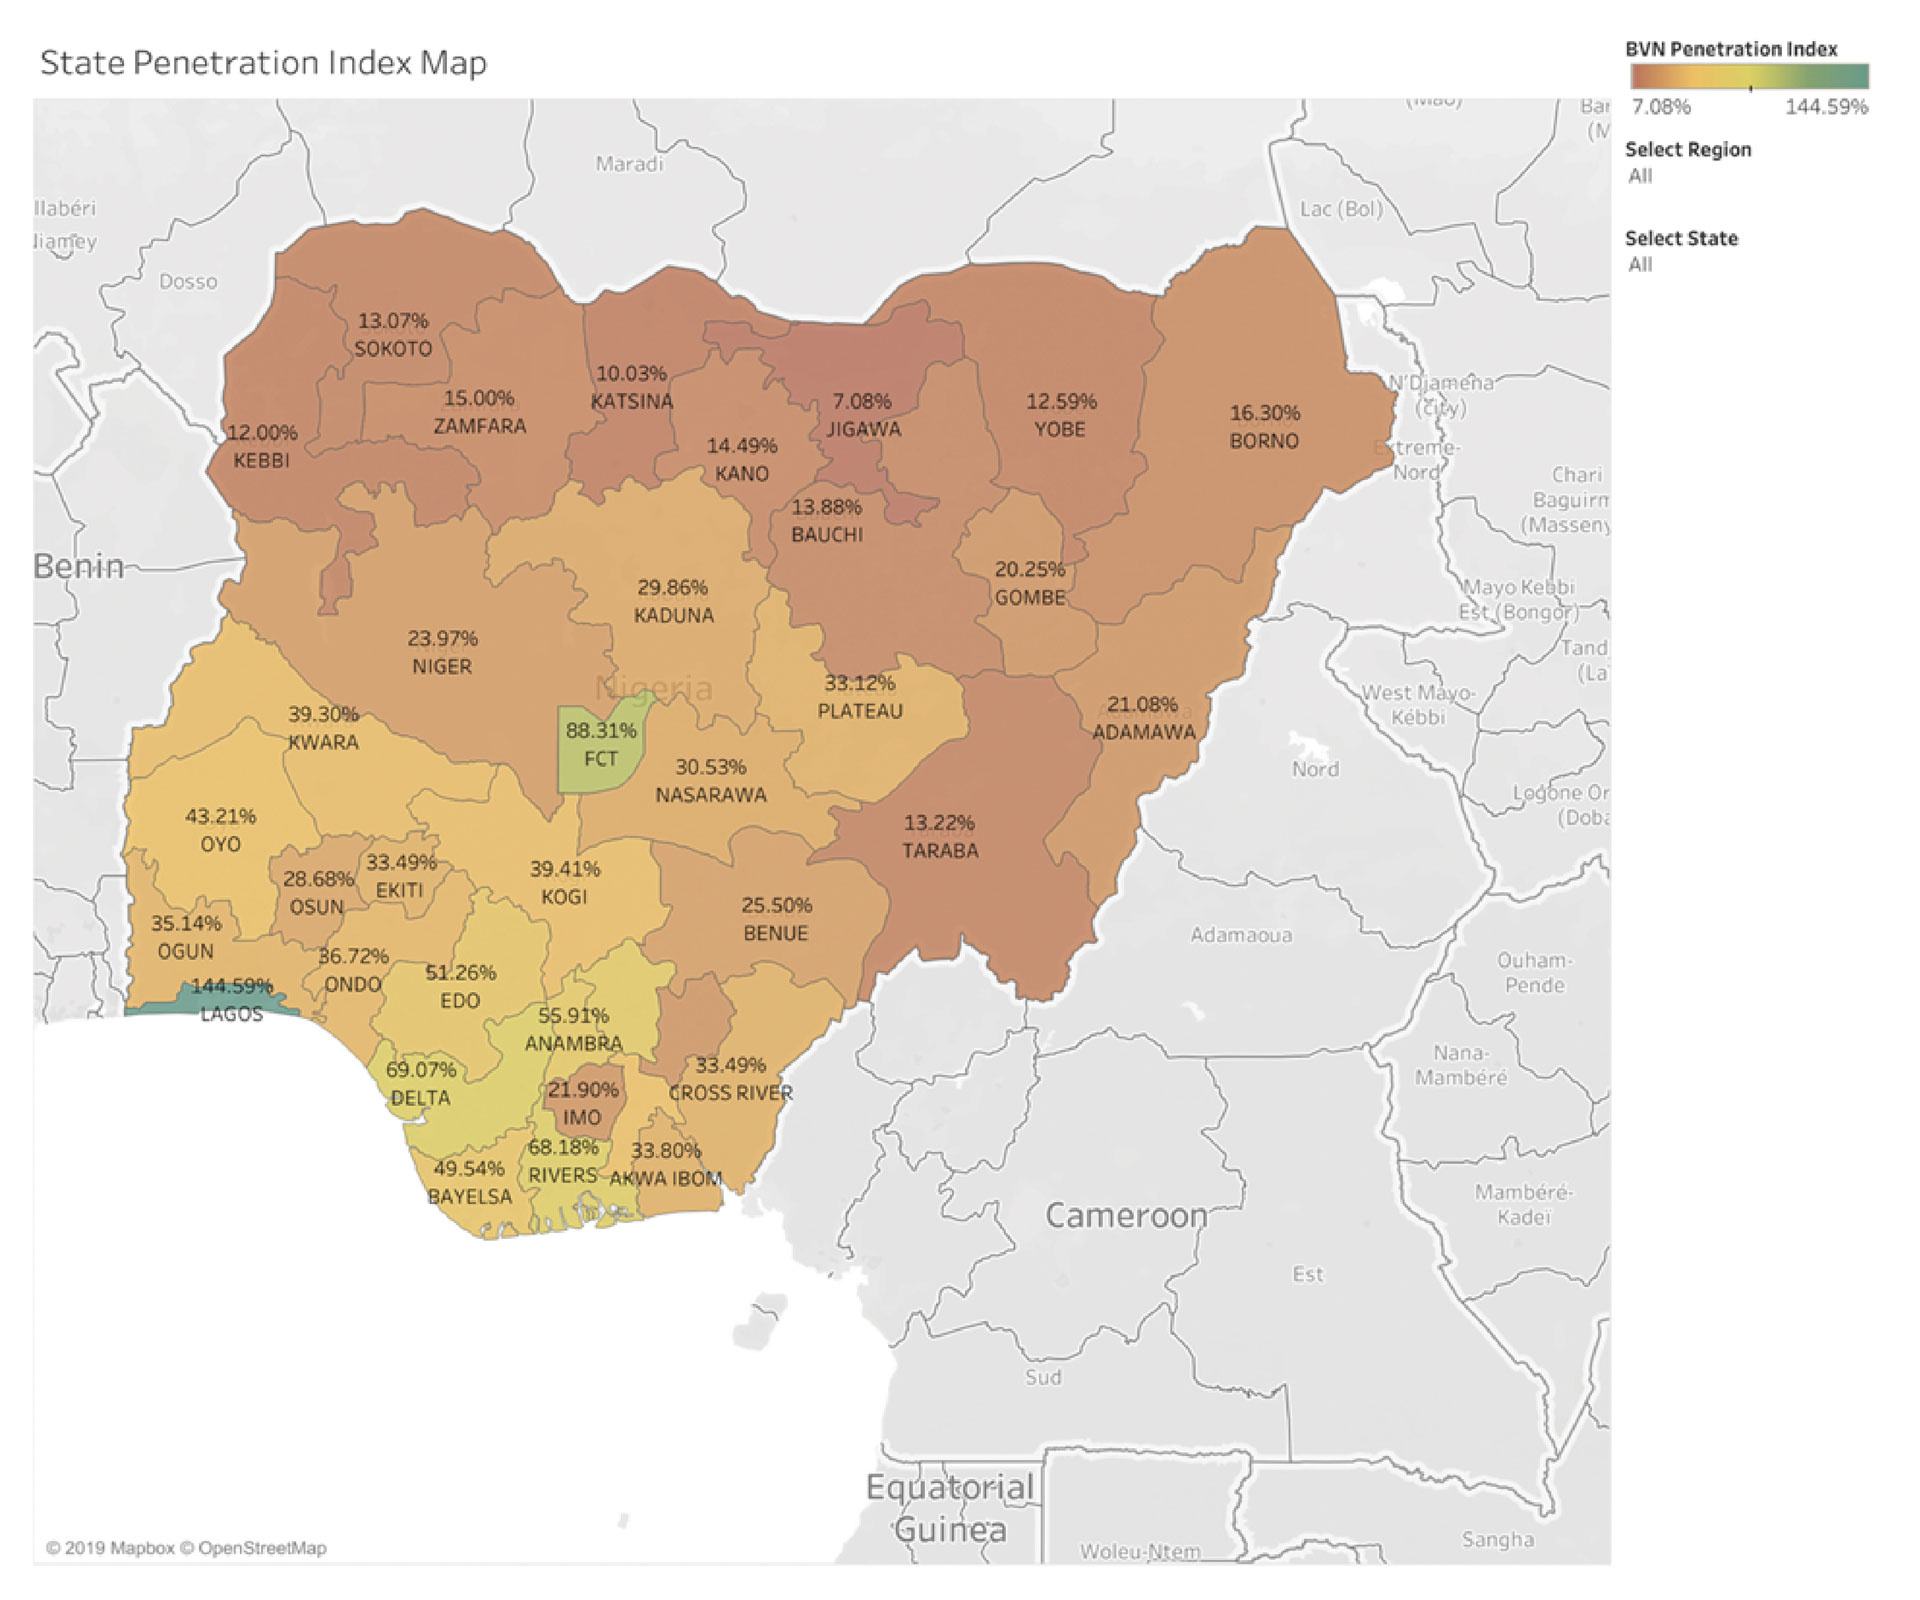
Image 1. Map of the BVN Penetration Index for each state in Nigeria
Source: Data Science Nigeria. “State Penetration Index Map.” Use Case 1 (Open Data Ecosystem Project), 11 September 2019, Columbia University Campus, New York City. Slide 6.
The greater than 100% anomaly in Lagos is plausible for a number of reasons. Firstly, the value of the denominator, which is the estimated adult population in Lagos, represents where people live, rather than where they work–in other words, the night-time population. The day-time population is likely to be much higher than at night, since Lagos is a business hub that receives residents from neighbouring states during the day. The BVN database captures information on the location where the account was opened, not where the individual resides. Additionally, a BVN is assigned to an individual for life. Therefore, if an individual opens an account in a location of high-penetration and moves to a low-penetration area, the BVN location information doesn’t change. Finally, the GRID3 population dataset that was used does not provide estimates in designated commercial areas, which comprise a large part of Lagos. These factors contribute to an overestimation of financial inclusion in Lagos, particularly because it is a state with so much commercial activity.
In addition to this index, which captures the entire population, gender-specific calculations were generated. The “unbanked” male and female populations were calculated by simply subtracting the number of BVN accounts by the total male and female populations at national and regional scales. 61% of the total population is unbanked.
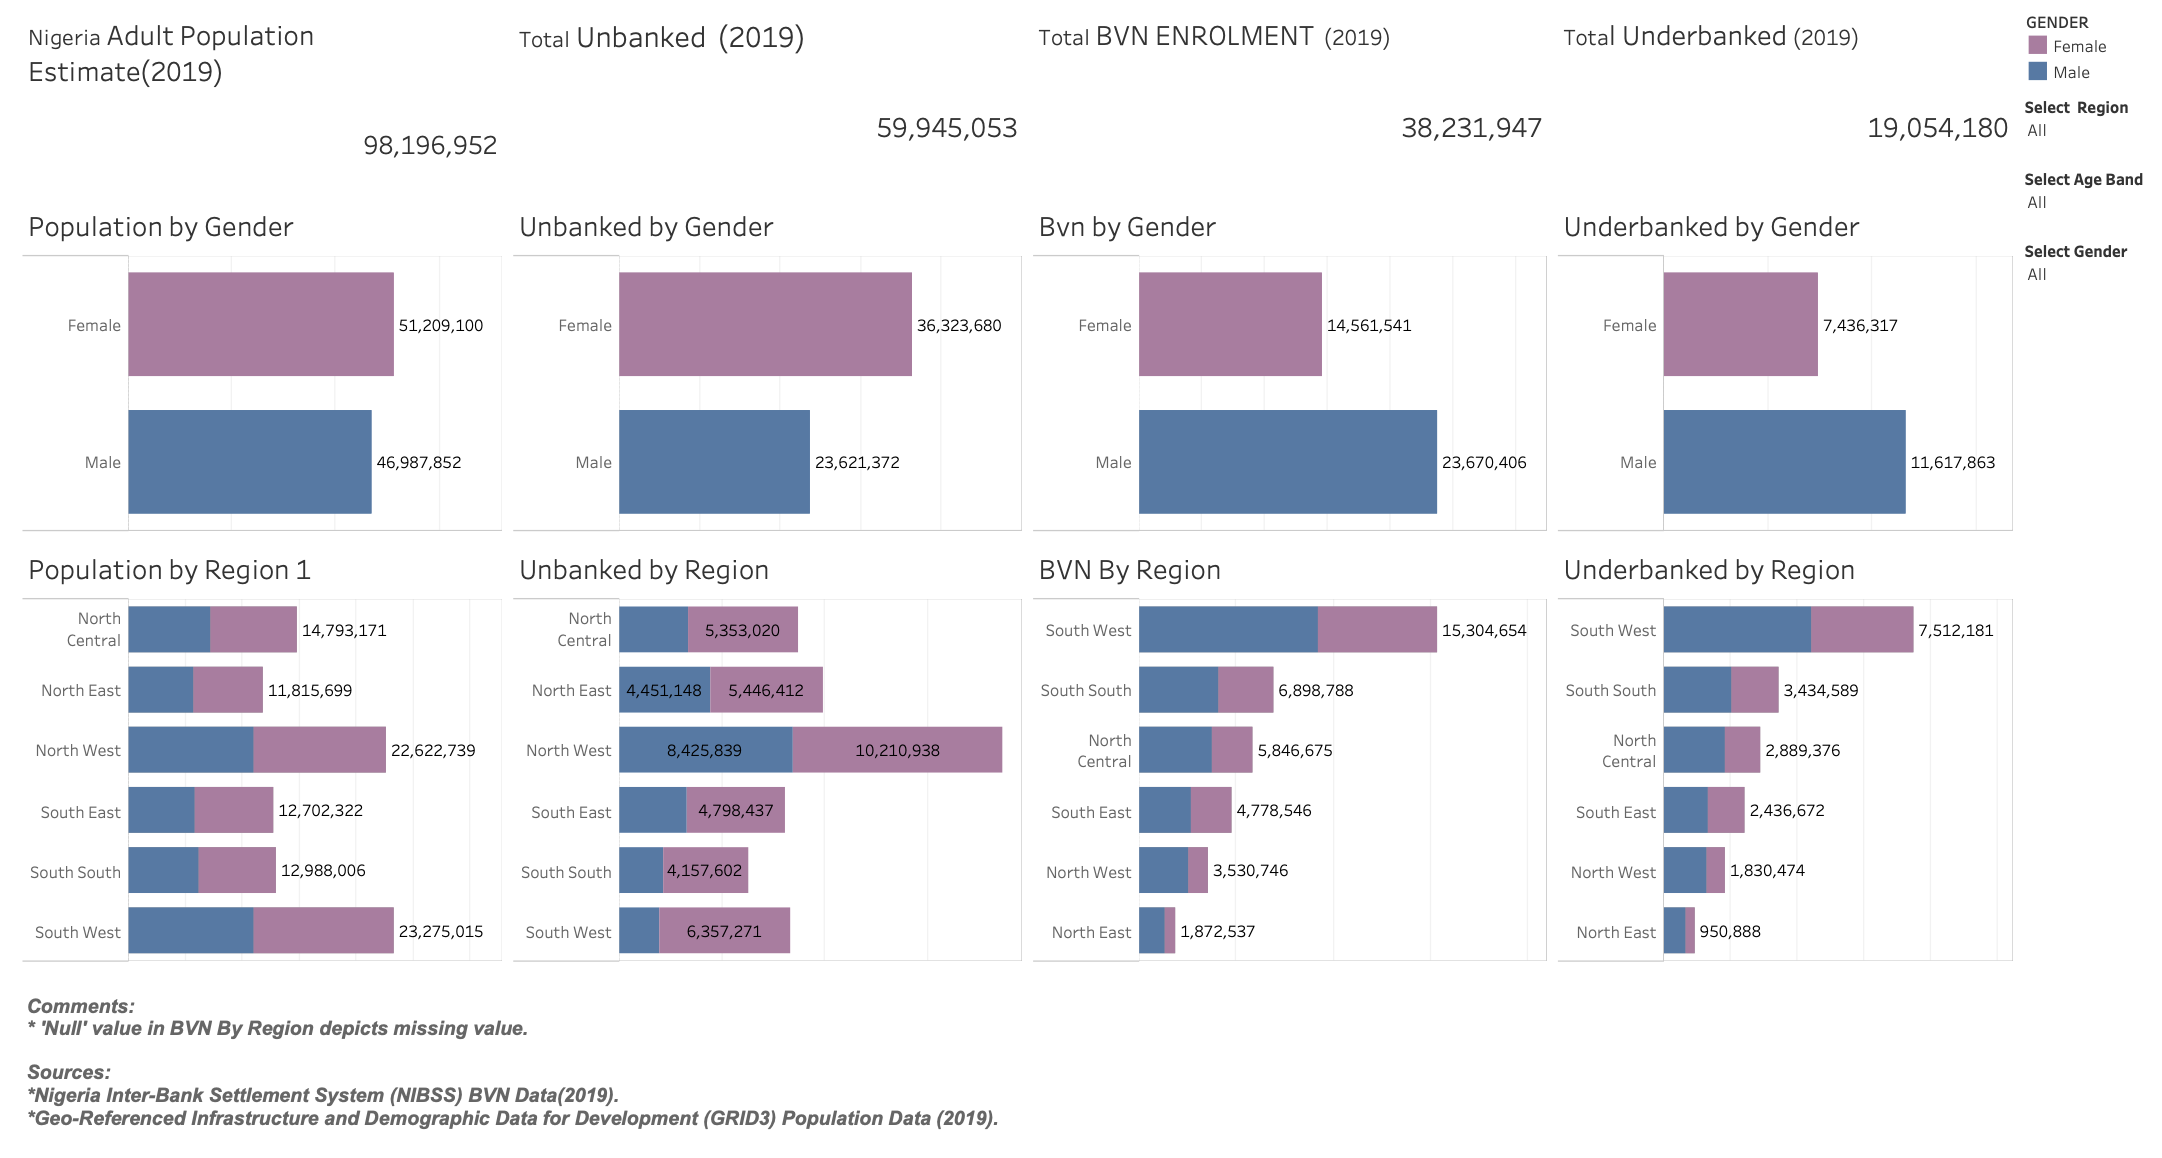
Image 2. National and regional calculations of total as well as male and female unbanked, banked, and underbanked populations
Source: Data Science Nigeria. “Demographic factors of the unbanked and non-interbank senders.” Use Case 4 (Open Data Ecosystem Project), 11 September 2019, Columbia University Campus, New York City. Slide 5.
As demonstrated in Image 2, 60% and 40% of the total unbanked population is comprised of females and males, respectively. The higher percentage of unbanked females compared to males is consistent, albeit in different proportions, among all regions; the greatest difference between genders is observed in the South West.
The GRID3 Nigeria population estimates dataset allowed for these insights to be generated. Without it, accurate financial inclusion indicators demonstrating differences between regions, states, LGAs, and genders, would not have been demonstrated. Because of the spatial granularity of the data as well as the age and gender breakdowns, it was possible to identify financially included and excluded adult populations at the LGA level, which was not previously possible; traditional analyses were limited to the regional scale.
Next steps
DSN is continuing to generate additional financial inclusion analyses and visualisations for the work. They expressed an interest in applying confidence intervals, associated with the population estimates, to conduct a sensitivity analysis to gauge indicator robustness. This analysis would essentially demonstrate, in a measurable way, how the indicator depends upon the uncertainty associated with the population estimates. As previously stated, this work is expected to support the national financial inclusion agenda and policy decision-making. The platform has made data more discoverable, accessible, interoperable, and reusable for stakeholders and interested parties.
Learning and continuous development
This financial inclusion use case conducted by DSN is an example of a situation in which GRID3 data seamlessly filled an immediate need that produced impactful results. DSN recognised that application of the GRID3 Nigeria Population Estimates dataset would meet their need to produce insights on the demographics of financial inclusion, and GRID3’s efficient assistance has the potential to make a large impact. Therefore, it is important to continue to promote GRID3 data at outreach events, demonstrate its use and unique application, and share it freely, so that more use cases of this nature can arise. An important lesson that was learned throughout this process is that particular age/sex cohorts should be pre-generated, so that they can be shared immediately with the data user as doing so after the fact causes difficulty.