Utilising Geospatial Data to Plan Routine Vaccination Strategies in the Democratic Republic of the Congo
Background
Routine vaccination in the Democratic Republic of the Congo (DRC) is informed by a planning process referred to as “microplanning”. The DRC health system is organised into health areas and health zones nested within provincial boundaries. The smallest unit, the health area, is the service area of a health facility where vaccinations are administered. In the microplanning process, information about the number, age, and distribution of the population within a health area and the names of settlements where people live are collected via a bottom-up approach by local health workers and community volunteers. These data are crucial to determining the appropriate vaccination strategy and resources required for targeted interventions. Vaccinations are administered at health facilities to persons living within five kilometres of the facility, or at an outreach site for persons living farther away. The information collected is then channelled up the hierarchical health system structure to the central level, where decisions about the allocation of resources (such as vaccinations and funding) are made. The 2013-2014 Demographic and Health Survey registered basic complete vaccination coverage at 45% for children aged 12-23 months nationwide and wide variation both within and between provinces.
Challenge and need
Collecting, compiling, and reporting the information required to make decisions is a time-consuming and logistically challenging task. Population counts can involve subjective guesswork and are often inaccurate; no spatial information about settlements is collected; and there is almost no government budget to recruit, train, and pay community volunteers. Frequently, the information collected in hard copy either does not reach the central level because of bottlenecks caused by delays in reporting, poor channels of communication, limited resources, and inaccessibility; or the information is rejected because there is a lack of confidence in the numbers reported. Often, decisions about the quantity and distribution of resources (such as vaccines) rely on population data that were collected in 1984. These challenges—coupled with hard-to-reach and highly mobile populations, stockouts, and imprecise service area boundaries—contribute to poor vaccination rates. Poor vaccination coverage causes 1.5 million deaths globally from vaccine-preventable illnesses annually, many of which are children under five years old. Without precise and mutually-agreed-upon boundaries and accurate population and demographic information, it is impossible to understand the true extent of vaccine-preventable deaths and plan strategic interventions.
Key stakeholders
- DRC Ministry of Health
- Expanded Programme on Immunisation (Programme Elargi de Vaccination) (PEV)
- National Health Information System Division (Division du Système National d’Informations Sanitaires (DSNIS)
- Central Bureau of Census (BCR)
Response
In close coordination with the DRC’s Ministry of Health, GRID3 responds to these challenges by using a participatory approach to mapping settlements and delineating health area boundaries from the bottom up by training local health workers to collect the names and precise geolocations of settlements and health facilities, relying on the workers’ expertise and unique perspectives as end-users to guide the validation process. The resulting data are consolidated into three data layers: health facilities, settlements, and service area boundaries. In addition to these data layers, high-resolution population estimates and demographic data are produced involving a sampled population survey and machine learning. A community-centred approach and the engagement of stakeholders from various levels of the health system are essential for the full integration, useability, and ownership of the data and outputs.
As part of the Mashako Plan, a strategic vaccination drive targeting vulnerable areas, Kwilu Province was selected to pilot the integration of spatial data into the current microplanning system. In January 2020, the Kwilu Digital Microplanning Workshop was organised in Kinshasa, DRC with stakeholders from various levels of DRC’s health system. The workshop was structured in a way that allowed hands-on participation in order to maximise learning outcomes and exchange of information, and provides a platform to use the data and outputs practically. Health workers and administrators from the central level described the challenges they face in performing their role in the microplanning process and identified where the data could be integrated into microplanning.
Data
- GRID3 DRC Kwilu Population Estimates
- Kwilu Health Area Boundaries
- Kwilu Health Facilities
- Kwilu Settlements
- Maxar feature extraction data based on most recent imagery
Outcome and impact
During the Kwilu Digital Microplanning Workshop, decision-makers used maps and population estimates to determine the appropriate number and geographic distribution of vaccines. At the more local level, health workers used the maps to compute distances and estimate travel time, designate vaccination outreach sites, and identify populations routinely overlooked under the current strategy. Participants compared a sketch of a health area that is currently used for planning with a map of the same health area produced from the data, discussed advantages and disadvantages of each, and gave constructive feedback about the presentation of the data and key map features (such as roads and rivers).
Testimonials from workshop attendees:
“Atelier de grande importance pour nous permettre d’ameliorer les couvertures dans le service de vaccination.”
Translated: “The workshop was of great importance to allow us to improve coverage of the vaccination service.”
“Atelier super interessant, le digital au service de la microplanification, INNOVATION sans contest. BRAVO.
C’est une suggestion qui consiste au renforcement des capacités à tous les niveaux.”
Translated: “Super interesting workshop, digital at the service of microplanning, INNOVATION beyond compare. WELL DONE. This is a suggestion which consists of capacity building at all levels.”
“Nous sommes émerveillés du contenu qui va nous permettre à changer nos décisions en fonction des données géo-spatiales.”
Translated: “We are amazed at how the content will allow us to change our decisions based on geospatial data.”
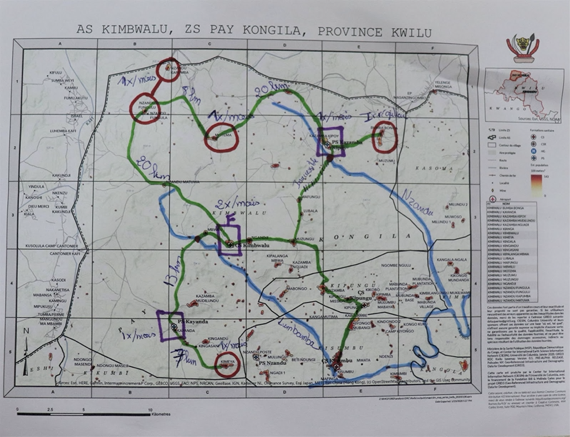
An example of a map health workers used to visualise current vaccination coverage, estimate distances, and plan routes for outreach sessions alongside a digital version.
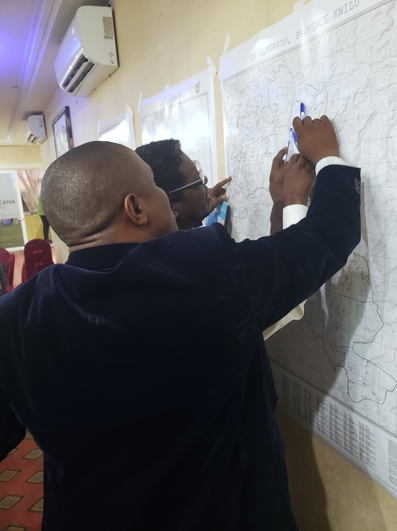
Health care administrators plan vaccination strategies with the help of geospatial data in Kwilu province.
Next steps
GRID3 is working in close collaboration with stakeholders in Kwilu to improve the data and update the maps based on feedback and validation gathered during the workshop. There is a strong interest in producing maps and tabular data at multiple levels of the health system structure as a tool to enhance the microplanning process before annual, national-level microplanning begins in September 2020.
Learning and continuous development
Based on high stakeholder interest, GRID3 and the Ministry of Health are strategising how to use the lessons learned at the workshop to improve deliverables, strengthen in-country capacity, and scale up.