Tackling COVID-19 in Nigeria: using population data to model virus spread post-lockdown
Where is the rate of COVID-19 transmission highest? Based on current infection rates, what measures could be put in place to flatten the curve? Does asymptomatic or pre-symptomatic transmission exist? To answer these questions, the Government of Nigeria collaborated with researchers from the United Kingdom’s University College London (UCL) to study, using GRID3 Nigeria’s gridded population estimates, the transmission of SARS-CoV-2 — the virus causing the COVID-19 disease — across Nigeria.
In this study, UCL’s team used GRID3 data to model the spread and impact of the virus. Their findings were then used to estimate the impact of post-lockdown control measures and inform the government response to the pandemic. The team developed a mathematical model to study transmission according to age and location, based on a previous study in London.
GRID3 Nigeria’s gridded population estimates were especially important to the study because they represent the most timely picture of where people live across the country, at very high-resolution. The most recent census in Nigeria took place in 2006, and GRID3 data fills a crucial gap by providing up-to-date, high-resolution, and accurate estimates of population density in between censuses that take place decades apart. GRID3 data splits the entire country into grids that are approximately 100×100 metres squared and estimates population by age and sex within each grid.
Example of high-resolution population estimates
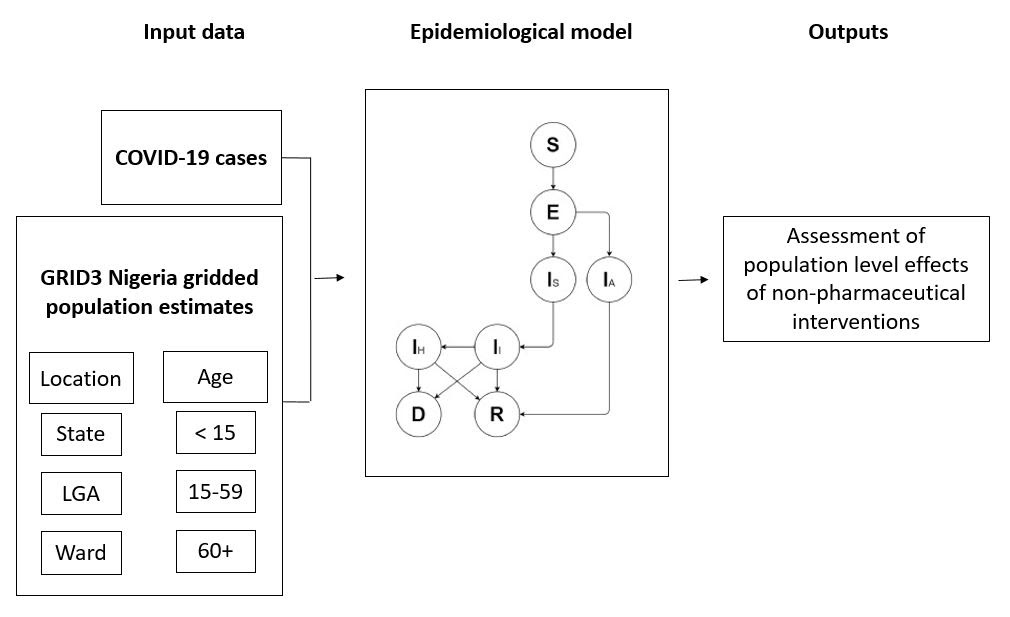
In order to understand virus transmission amongst Nigeria’s population, researchers needed access to high-resolution and recent population density data, in addition to current COVID-19 cases. UCL’s team used the GRID3 Nigeria population totals at state, Local Government Area (LGA) and ward levels, disaggregated by three age groups (<15, 15-59, 60+ years), as inputs to the epidemiological compartmental model so that the population could be divided into healthy and infected individuals while still accounting for age-specific and geographic variations in transmission.
UCL used a modified Susceptible – Exposed – Infectious – Recover (SEIR) compartmental model. The model assumes that all inhabitants of Nigeria are initially susceptible (S) to infection. When contagion occurs, inhabitants move to the exposed compartment (E) and remain there until they become infectious (I). At that stage, people are either symptomatic (Is) or asymptomatic (IA). A proportion of each category will eventually have to self-isolate (Ii) or be hospitalised (IH) and will either recover (R) or die (D).
Adapted from Gosce et al, 2020
The GRID3 population counts were used to estimate how many people were in each initial “compartment” of the model in order to then predict how the size of each compartment changed over time.
Using model outputs, UCL provided Nigeria’s Presidential Task Force on COVID-19 with evidence-based guidance on measures to curb the spread of the virus. Reports included estimates on the impact of non-pharmaceutical interventions, including community lockdowns and restrictions on gatherings, and guidance on scaling testing, isolation measures, and contact tracing across the country.


