Geospatial analysis of measles immunisation coverage in Nigeria
The 2017-18 measles post-campaign coverage survey (PCCS) in Nigeria was designed to produce estimates of measles vaccination at 1×1 kilometre and Local Government Area (LGA) level. These large-area estimates often mask spatial differences in coverage and do not facilitate targeting of immunisation efforts at the local scale.
To understand measles vaccination coverage, the GRID3 Nigeria team, following a request from the PCCS working group, analysed data produced from the PCCS survey in February 2019. The team also compared results from their analyses to previous PCCS coverage estimates using the 2013 Nigeria Demographic and Health Survey and the 2016-17 Multiple Indicator Cluster Survey / National Immunisation Coverage Survey. Prior to GRID3’s involvement, the PCCS team analyses and reporting were limited to the state level which do not demonstrate immunisation coverage variation at finer-scale administrative and settlement resolutions. By monitoring metrics at more localised scales, improvements in vaccination coverage can be properly measured over time.
Analysing the data
To perform the analysis, GRID3 Nigeria experts assembled over 72 geospatial covariate datasets and 30 covariates were selected. These were then run through a covariate selection process, after which six covariates were retained for the final analyses. The covariate data* selected for the final analyses included 1) proportion of people living in poverty, 2) pig density, 3) travel time to health facilities, 4) mean land surface temperature, 5) settlement type – urban/rural, and 6) distance to the edge of cultivated areas.
A Bayesian geostatistical model was then used for each of five PCCS indicators assessing the individual and combined performance of routine immunisation and the campaign, to produce coverage estimates at different spatial scales. GRID3 data was used to identify settlements in areas that failed to meet a coverage threshold of 50% during the campaign so that these could be prioritised and targeted during future vaccination campaigns.
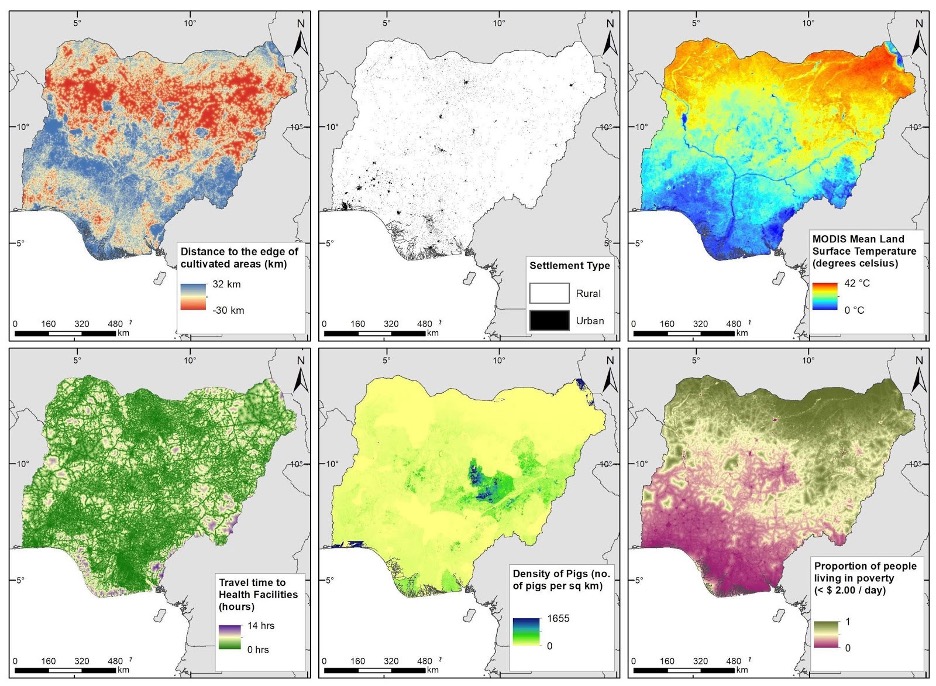
Covariates selected for the final model
Reviewing results
Findings from the analysis indicate that all poor coverage areas should be prioritised during the next campaign as well as through routine immunisation activities. The findings also point to the need to improve routine immunisation services across the country, particularly in the northern regions.
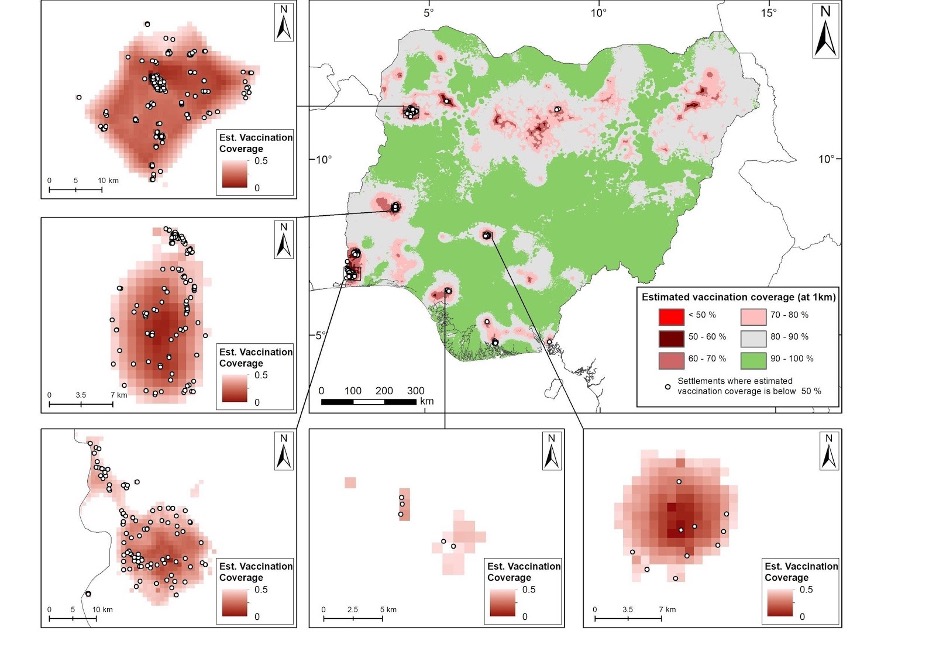
Estimated coverage during the campaign at 1×1 kilometre, highlighting low coverage areas with <50% coverage in red and other coverage classes in different colors. The white dots indicate settlements located within the low coverage areas. Inset (top left – bottom right): 276 (Kebbi), 132 (Oyo), 97 (Ogun), 5 (Edo) and 10 (Kogi) settlements are located in these low coverage areas. In all, about 681 settlements were identified in the low coverage areas.
In May 2019, the GRID3 Nigeria team presented these results with maps to the National Bureau of Statistics, the National Measles Technical Coordination Committee, and the Department of Planning, Research and Statistics at the National Primary Health Care Development Agency (NPHCDA). The team also presented a proposal to increase PCCS sample sizes at the cluster level to improve future geospatial analysis. Proposal recommendations will be applied when designing future PCCS surveys.
Looking forward
A new measles vaccination campaign and subsequent PCCS began in late 2019. The GRID3 Nigeria team will meet with NPHCDA and other stakeholders to track the results. GRID3 Nigeria also plans to perform similar analyses for upcoming meningitis, yellow fever, and measles immunisation campaigns. In these analyses, combining vaccination coverage estimates with GRID3 high-resolution population estimates will allow the team to estimate the number, instead of percentage, of children under five who remained unvaccinated after the campaign.