WHITE PAPER

Cartographier et Classer les localités

Analyse du travail de GRID3 pour collecter et analyser les données des localités. Ce travail se concentre sur deux pôles primaires: créer une couche des localités améliorée et exhaustive qui permet d’avoir une vue d’ensemble des communautés; utiliser les empreintes des bâtiments, les données géospatiales et algorithmes avec apprentissage automatique, pour classer les structures et zones locales au sein des localités. 

Cette étude explore les applications des méthodes de GRID3 au Nigéria, en République Démocratique du Congo et en Zambie.

Authors Center for International Earth Science Information Network; Flowminder Foundation; United Nations Population Fund; WorldPop, University of Southampton
Full publication

More publications

Reaching Never- and Incompletely-Vaccinated Children with Routine Immunization: A Proof-of-Concept Activity Using Geo-Referenced Microplans in Two Health Zones in Maniema Province, Democratic Republic of the Congo

GRID3’s geospatial mapping work in Kindu and Kibombo, Maniema Province, DRC, was central to a collaborative proof-of-concept with the DRC’s EPI Programme, CDC, and AFENET: participatory mapping and house-to-house enumeration located under-vaccinated children by locality, and GRID3’s maps then guided […]

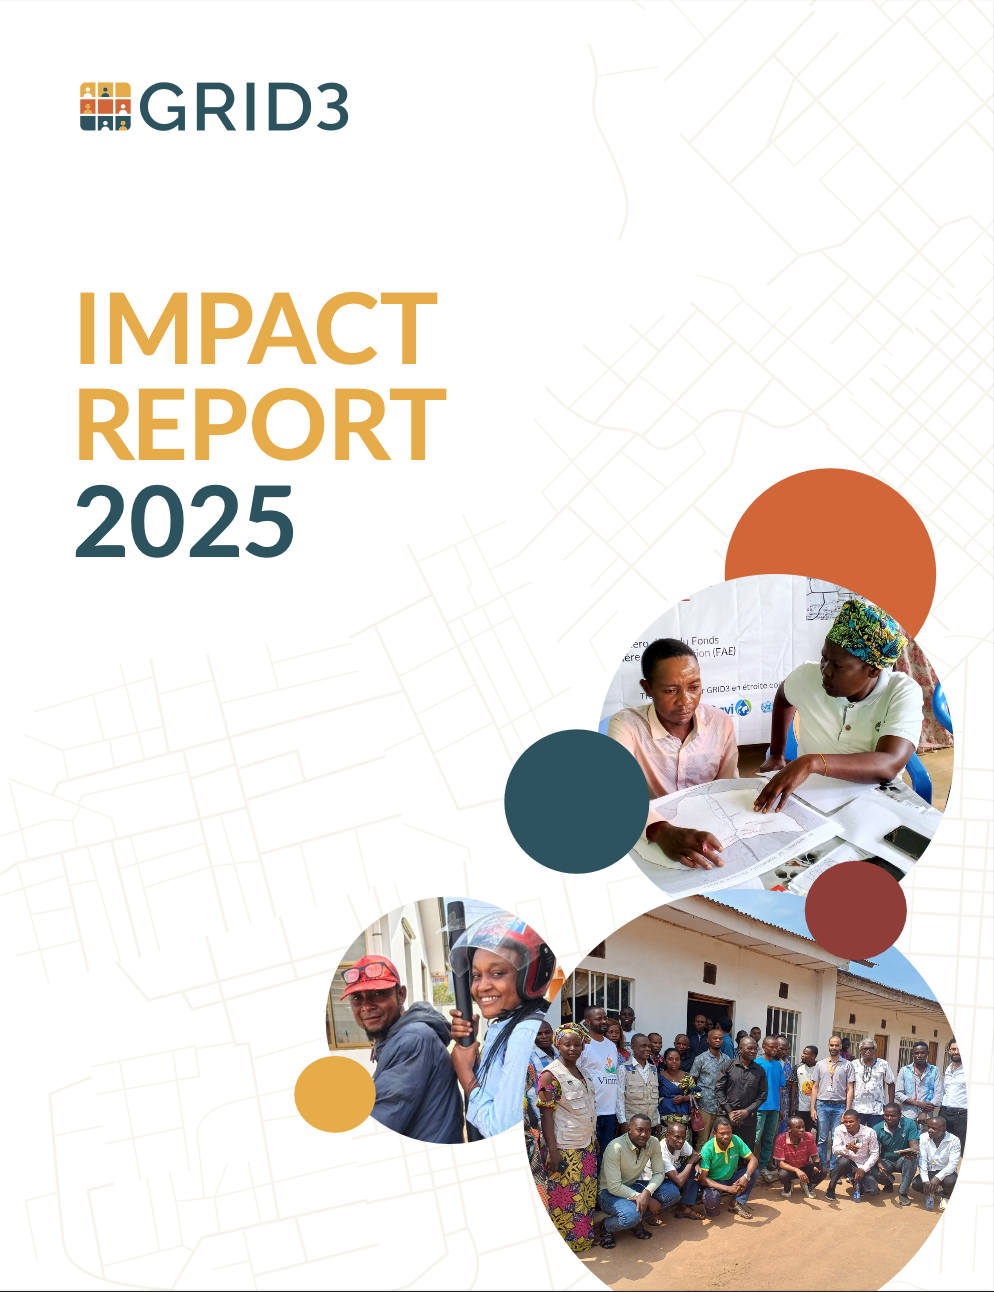
GRID3 Impact Report 2025

In Equateur Province, the Democratic Republic of the Congo (DRC), health workers had been told that communities along the Lokoro River were uninhabited — too prone to flooding, too hard to reach. GRID3 settlement data said otherwise, and in 2025, […]

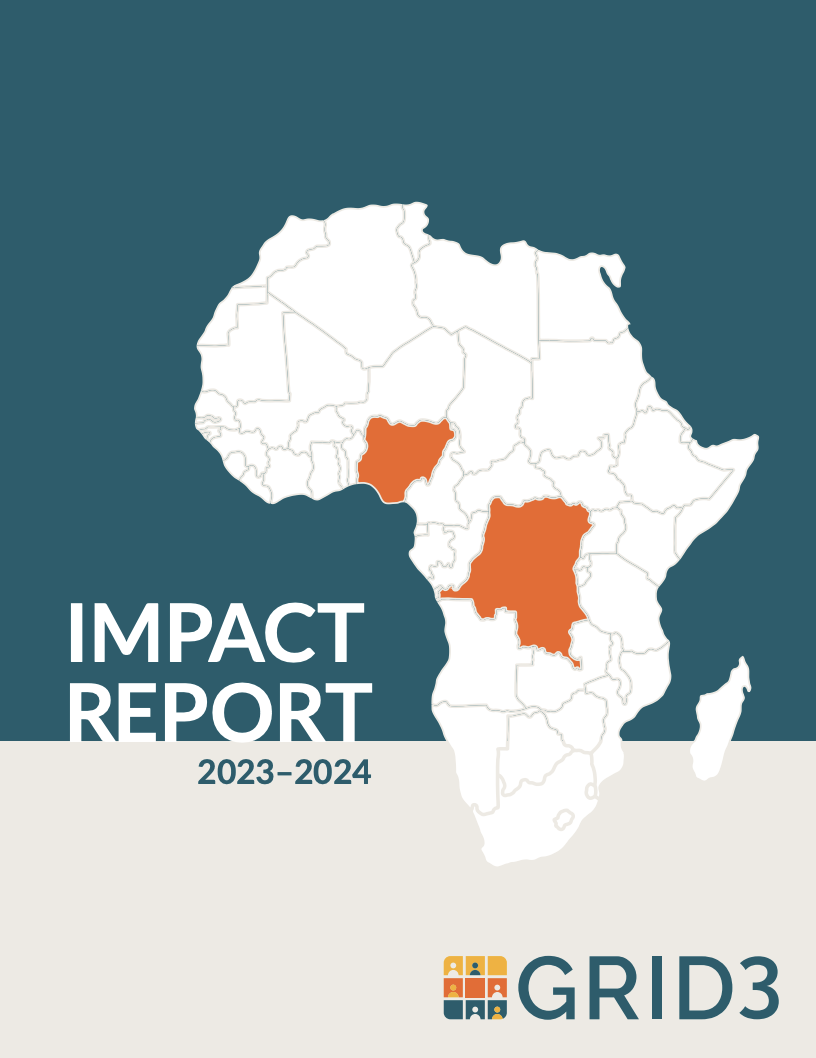
GRID3 Impact Report 2023-2024

Explore how GRID3’s core spatial data – including population estimates, settlements, health facilities, and administrative boundaries – are making a difference in Nigeria and the Democratic Republic of Congo. This report details our achievements between 2023 and 2024, highlighting our […]