Guidance note

Using GRID3 population data for COVID-19 vaccinations

Learn how to use GRID3 population data to visualise the locations, distribution, and characteristics of vulnerable populations who receive basic health services. These types of visualisations can support efforts to allocate resources and plan outreach activities for COVID-19 vaccination campaigns. They can also be used to inform planning for other health service delivery.

This guide includes visualisations of GRID3 population data that can answer the following planning-related questions:

  • Where are highly populated areas?
  • What is the relationship between COVID-19 cases and highly populated areas?
  • How to locate vulnerable populations for COVID-19 vaccination campaigns?
More publications

Reaching Never- and Incompletely-Vaccinated Children with Routine Immunization: A Proof-of-Concept Activity Using Geo-Referenced Microplans in Two Health Zones in Maniema Province, Democratic Republic of the Congo

GRID3’s geospatial mapping work in Kindu and Kibombo, Maniema Province, DRC, was central to a collaborative proof-of-concept with the DRC’s EPI Programme, CDC, and AFENET: participatory mapping and house-to-house enumeration located under-vaccinated children by locality, and GRID3’s maps then guided […]

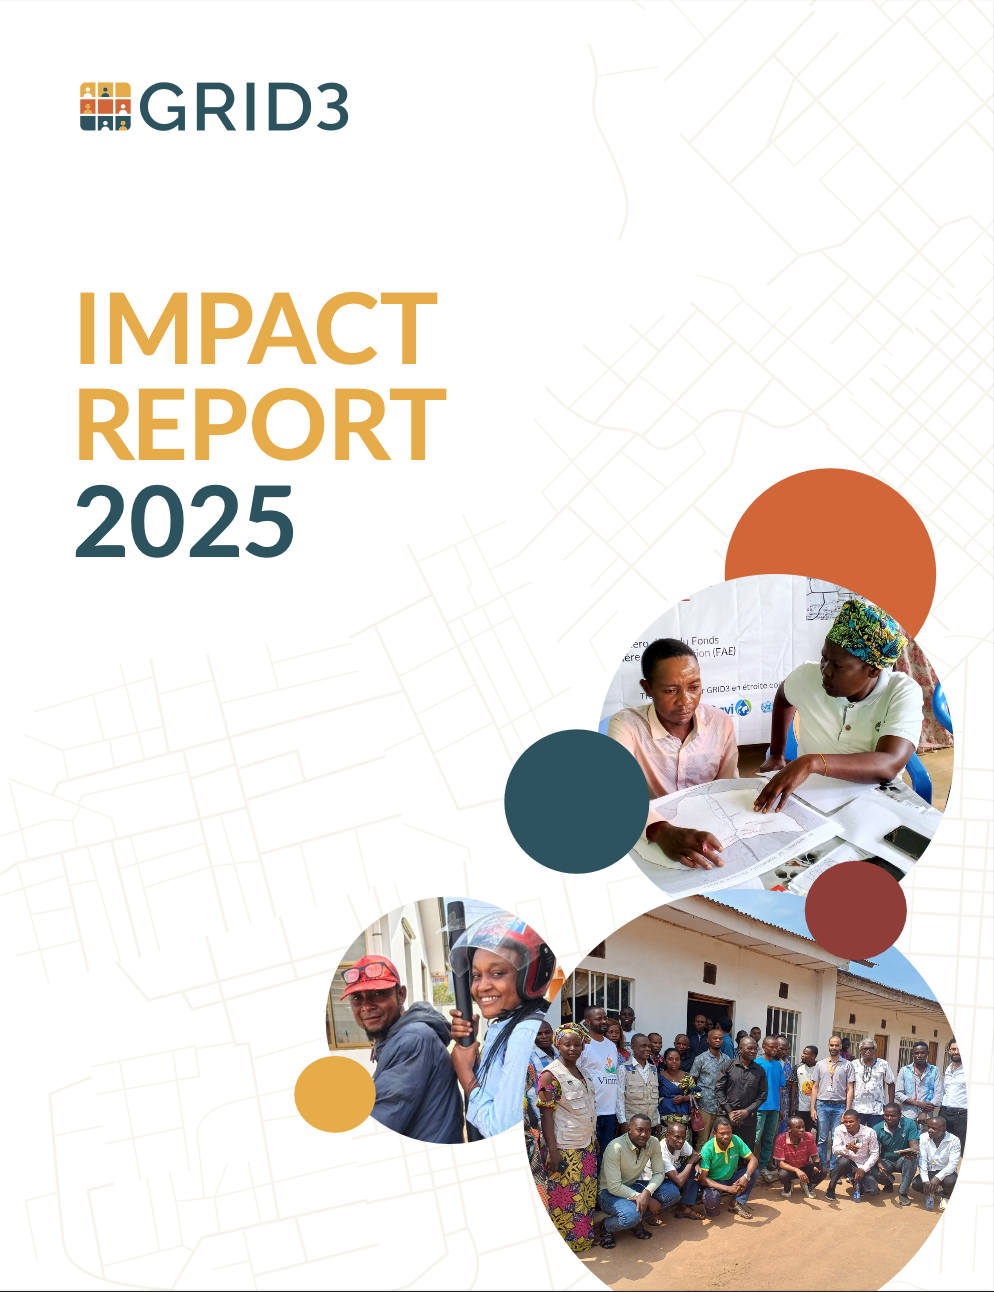
GRID3 Impact Report 2025

In Equateur Province, the Democratic Republic of the Congo (DRC), health workers had been told that communities along the Lokoro River were uninhabited — too prone to flooding, too hard to reach. GRID3 settlement data said otherwise, and in 2025, […]

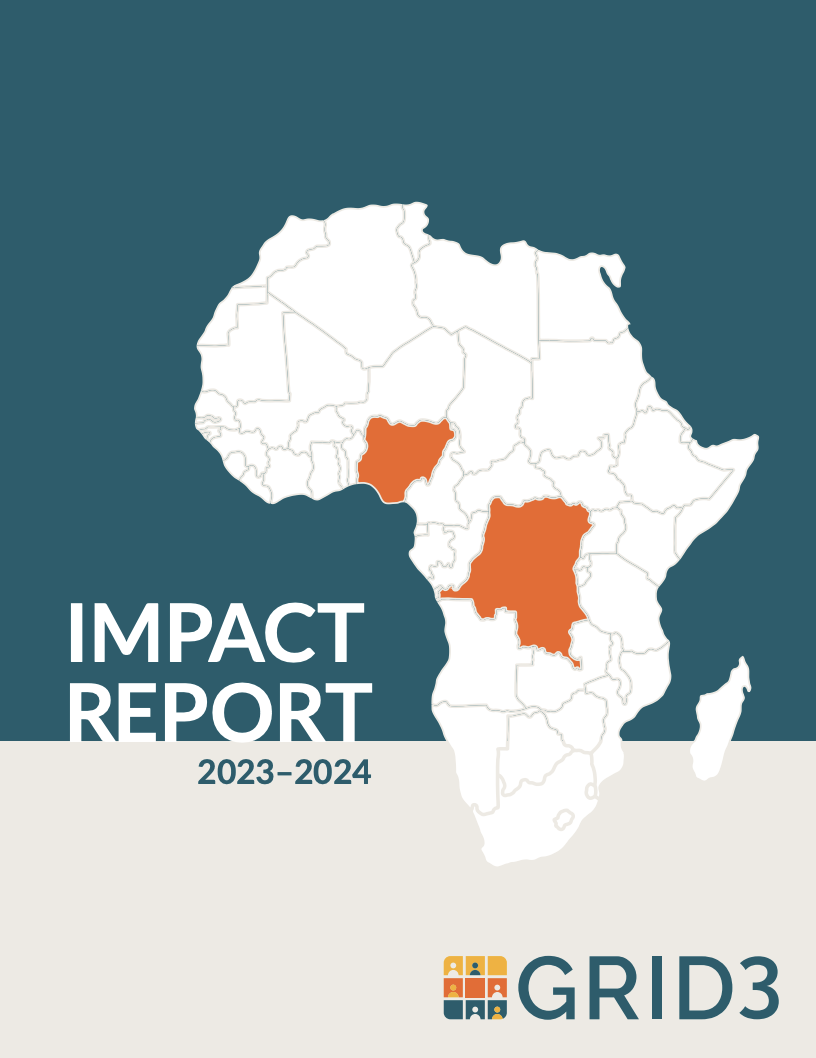
GRID3 Impact Report 2023-2024

Explore how GRID3’s core spatial data – including population estimates, settlements, health facilities, and administrative boundaries – are making a difference in Nigeria and the Democratic Republic of Congo. This report details our achievements between 2023 and 2024, highlighting our […]